NotaAI, 2019. 9. ~ 2019. 12.
Project Summary
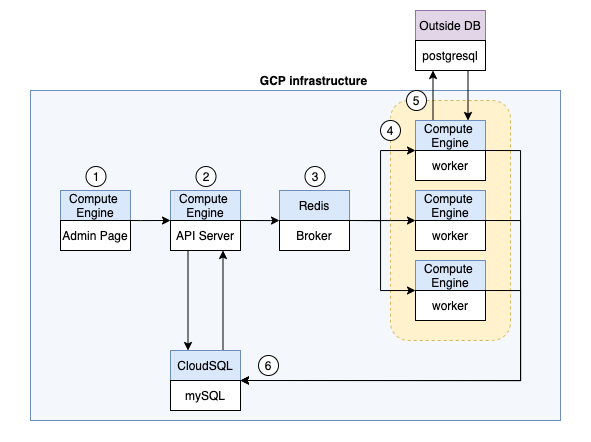
This is a project conducted during the NotaAI internship period. It was a project in which statistical indicators were periodically calculated from over 100 million card transaction data accumulated by each store and delivered to the customer. I designed the overall pipeline like below.

- Admin Page(ReactJS & nginx): Users can request or monitor data processing operations here.
- API Server(Flaks & gunicorn): Receiving a request from user. Then it creates a job, split it into tasks, and load it into the broker.
- Broker(Redis): Contains tasks divided into store units.
- Worker(Celery): Takes out a task from the broker and performs statistical indicators extraction.
- Outside DB(postgresql): Each worker reads the card transaction data from it.
- Own DB(mysql): Statistical indicators produced by each worker are stored in it.
- Retrial: When all tasks are completed, failed tasks are proceed once again. Then generated data is written to a csv file and uploaded to the client.
Role
- Designed overall service architecture
- Backend and frontend application development
- Built CI/CD pipeline with github actions and gcloud api.
- Deployed the applications to GCP infrastructures and operated it.
Tech Stack
- Infrastructure: Linux, Docker
- Language: python, javascript
- Frameworks: celery, flask, reactJS
- Library: numpy, pandas
Results
- The data processing pipeline works well since January 2020 without a big problem.
-
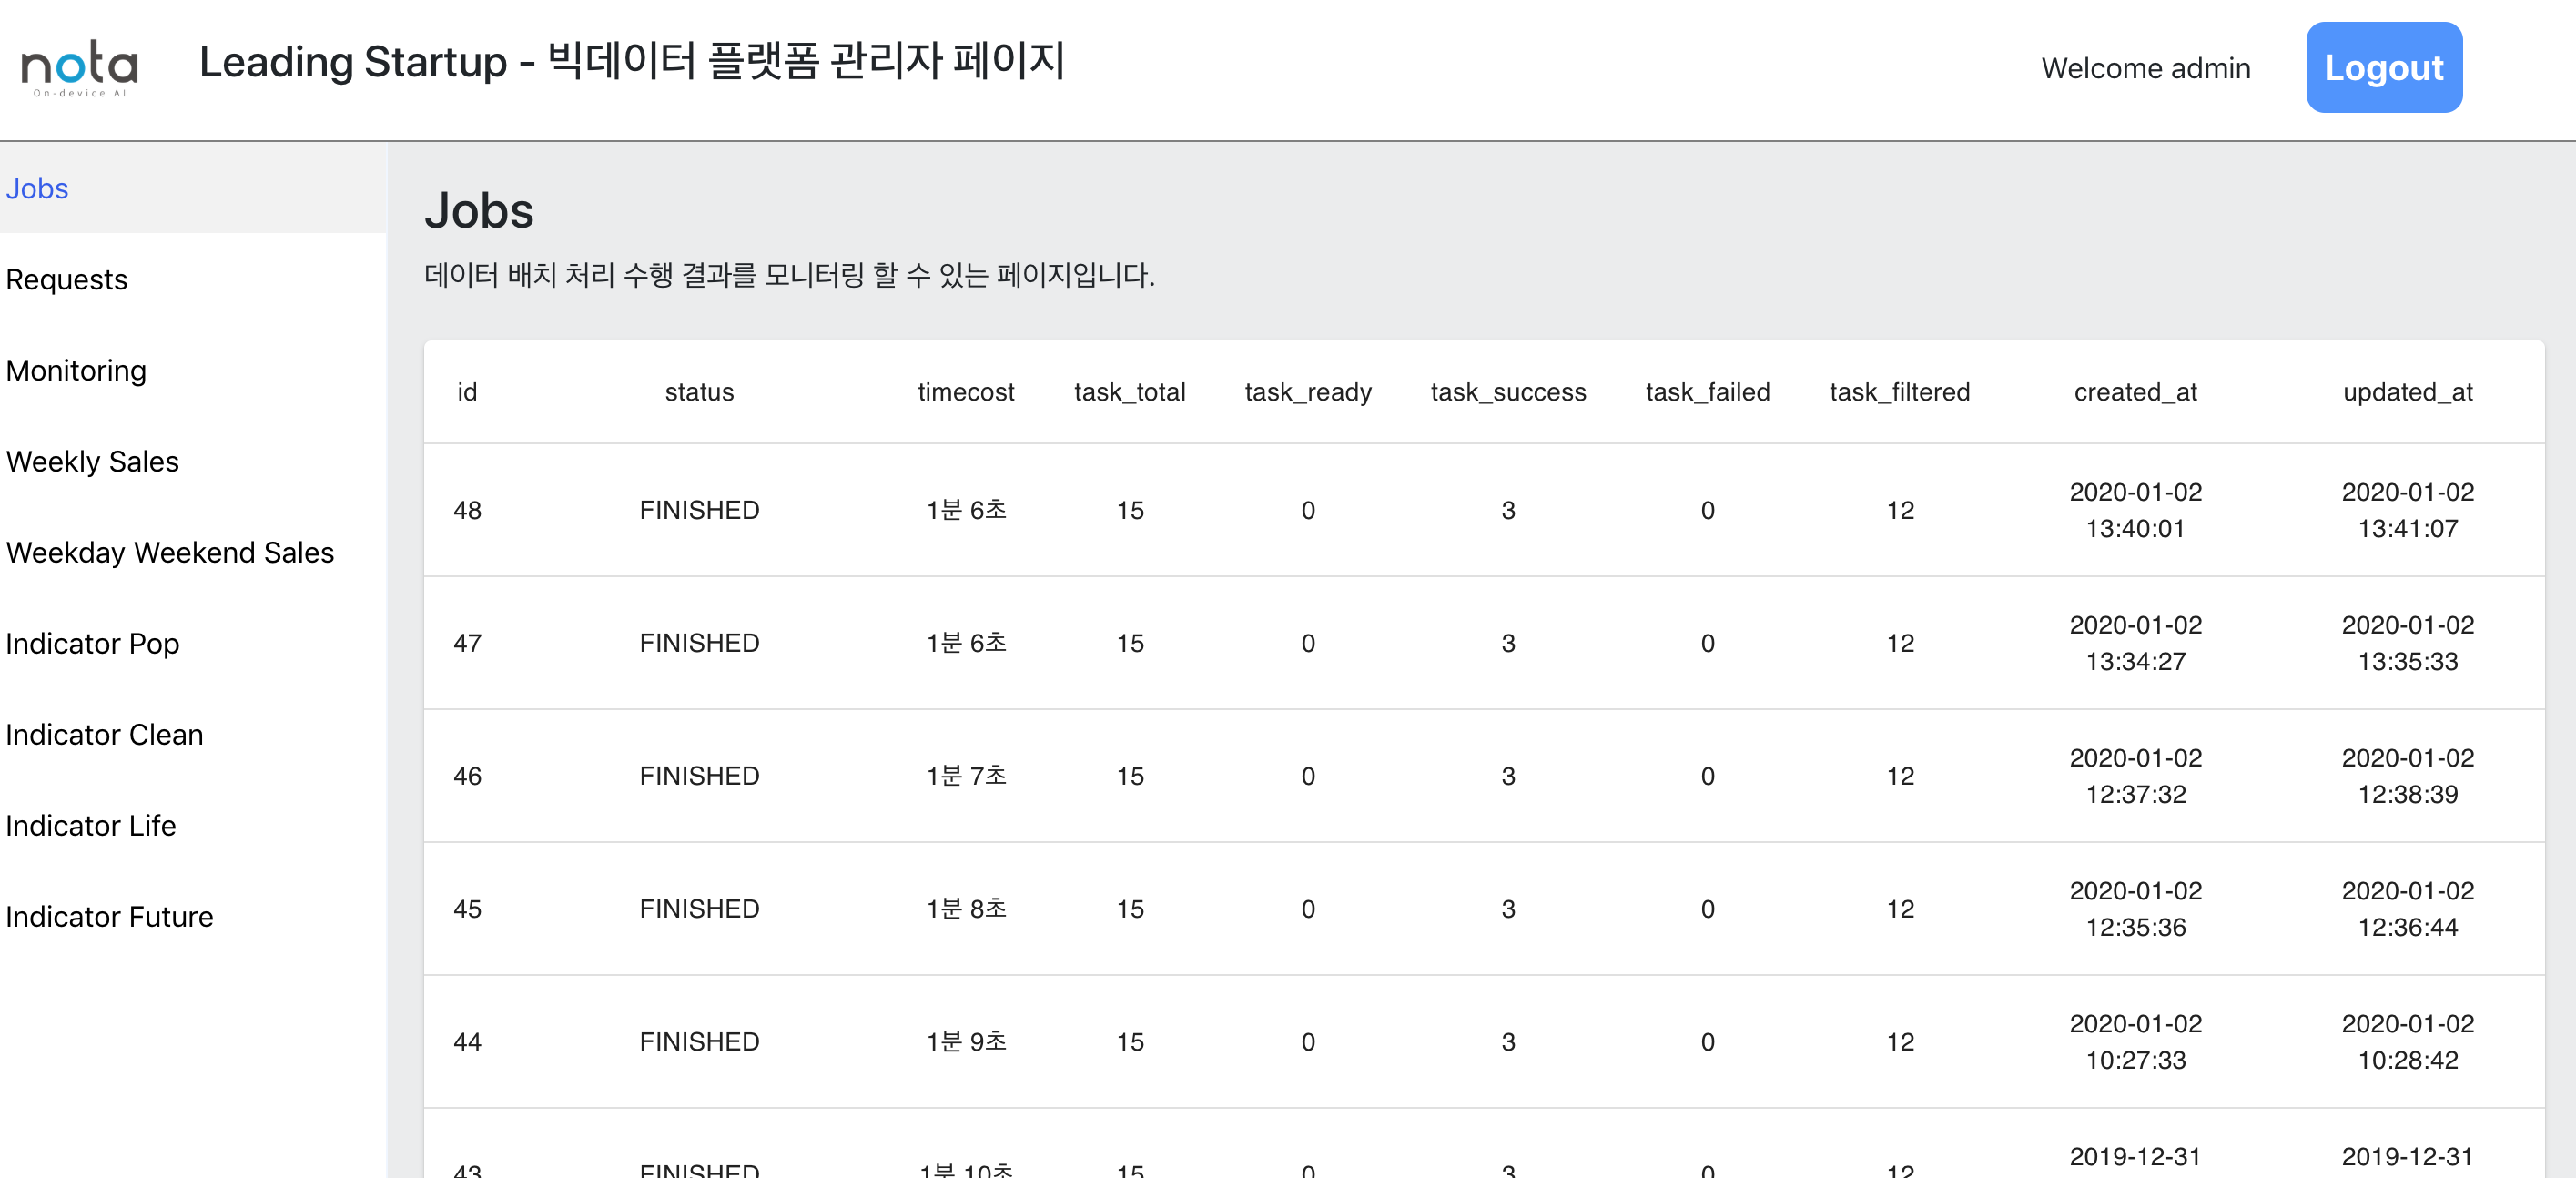
Admin page 1. job list

-
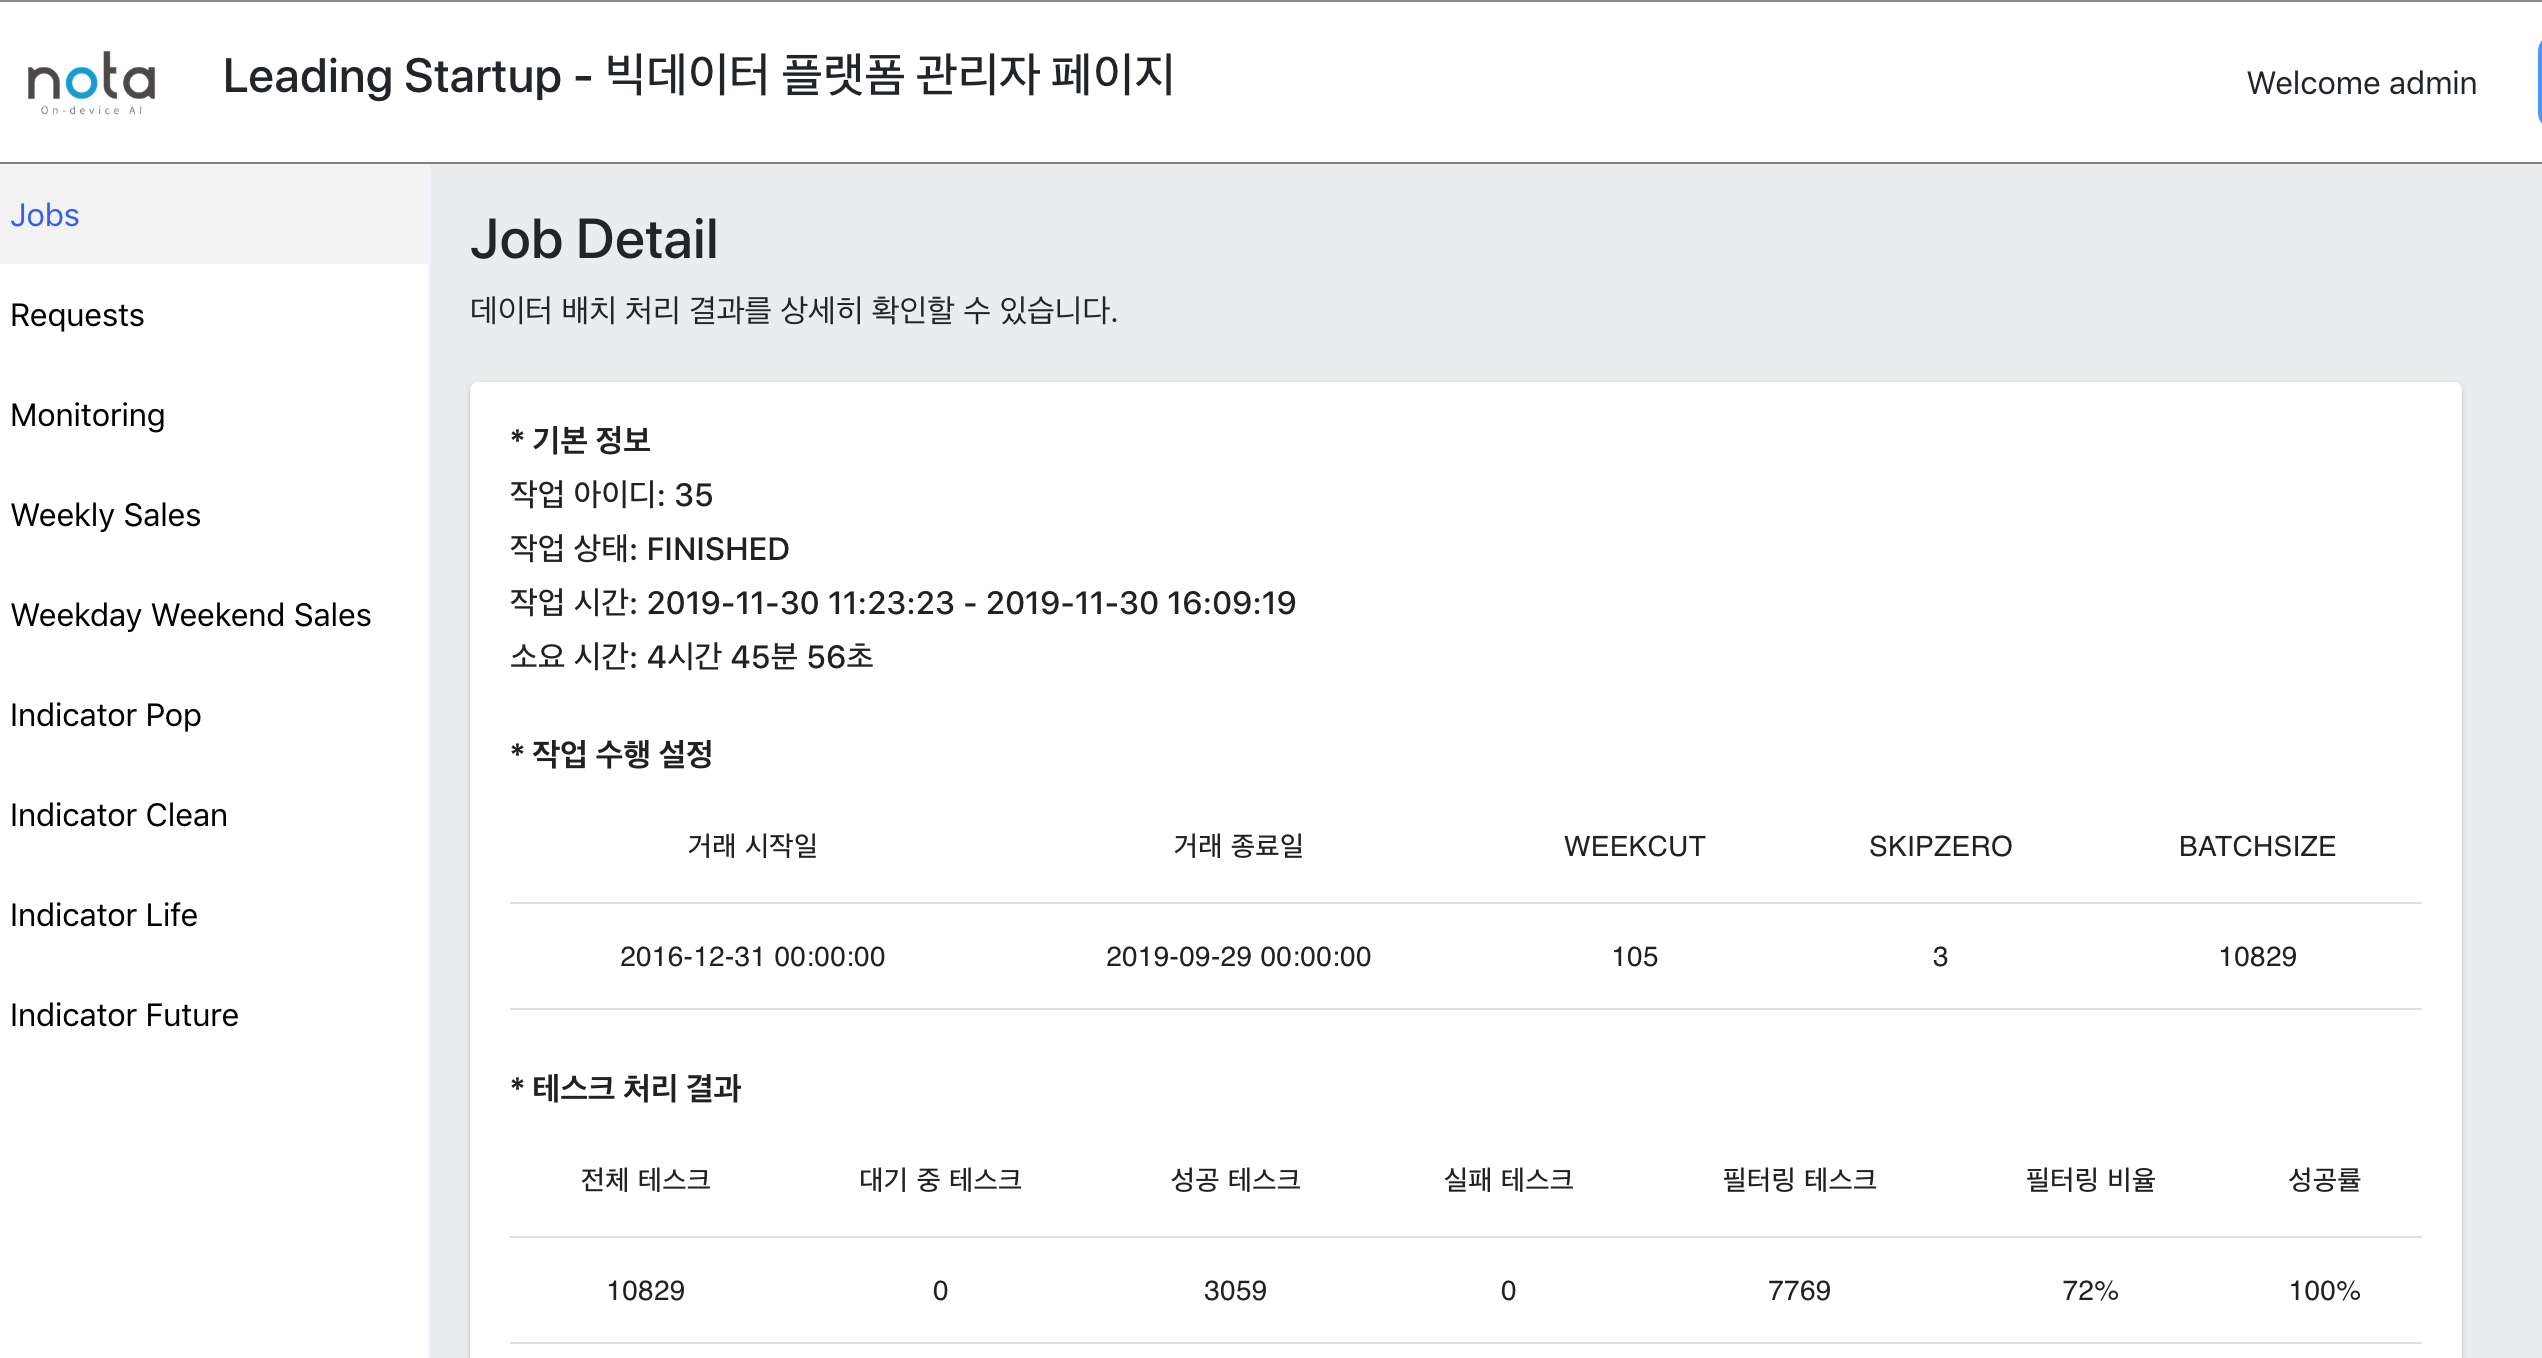
Admin page 2. job result

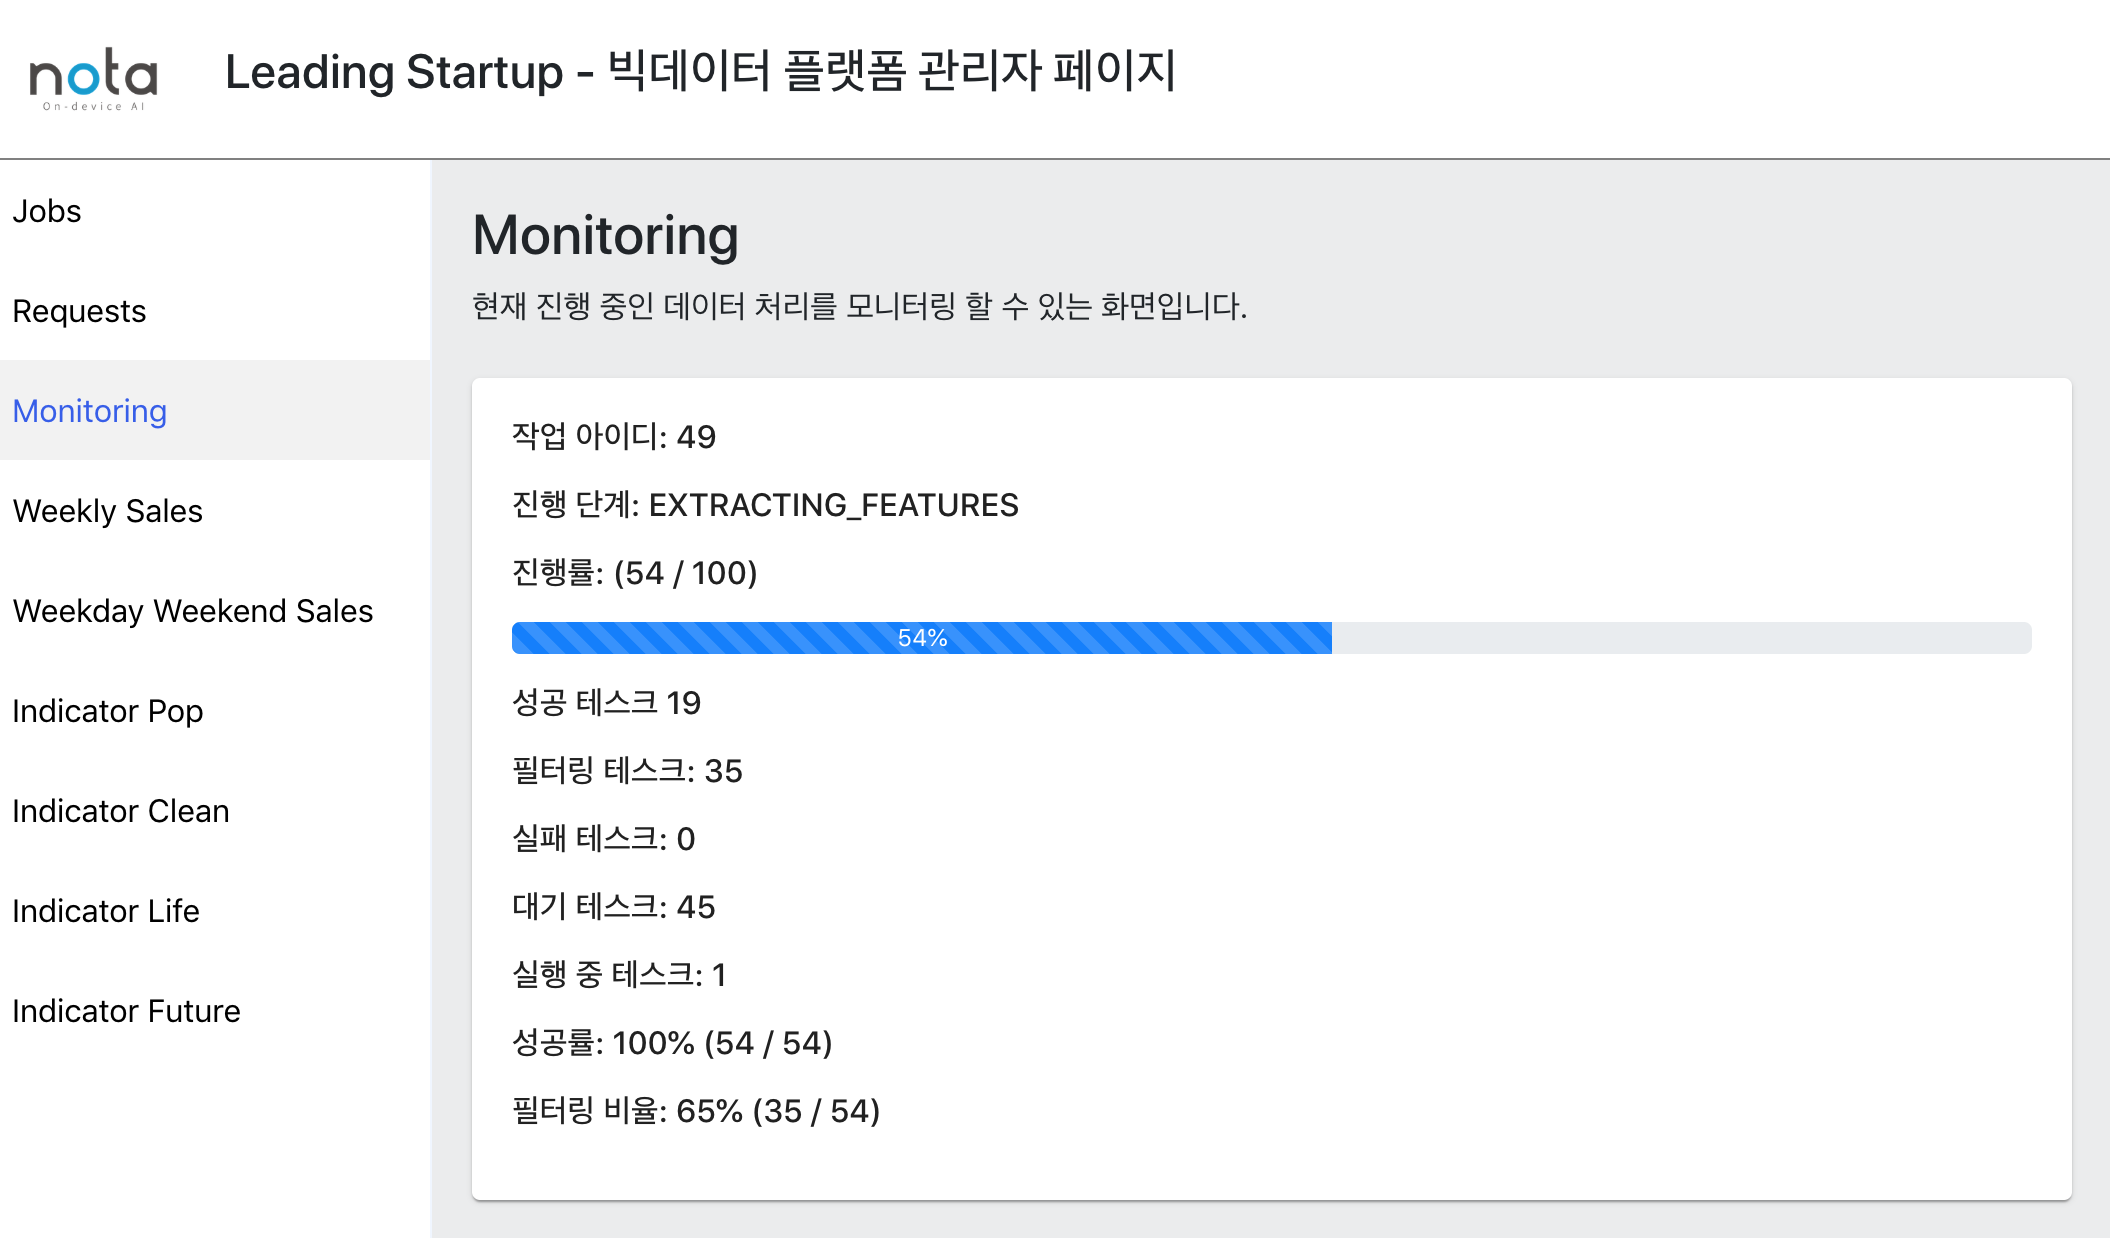
- Admin page 3. job progress monitoring

